The core of the TrueState platform is the AI assistant. This assistant can be accessed from the platform home page. It will take turns talking to you, in a similar way to other assistants like ChatGPT or Cursor. However, the TrueState AI assistant has the ability to examine your data directly in order to provide you with helpful insights. The TrueState AI assistant has a similar ‘IQ’ to other off-the-shelf chatbots. It understands programming languages and data science practices as well as the other mainstream chatbot offerings. Its world knowledge is as good as any AI. Where it shines is its ability to operate on top of the TrueState platform in order to understand your data and help you solve your data problems. The TrueState AI assistant has access to a suite of tools to understand the general nature of your data, and then to perform deep dives and detailed analysis directly. This section explains how the TrueState AI assistant works and how to best utilise it.Documentation Index
Fetch the complete documentation index at: https://docs.truestate.io/llms.txt
Use this file to discover all available pages before exploring further.
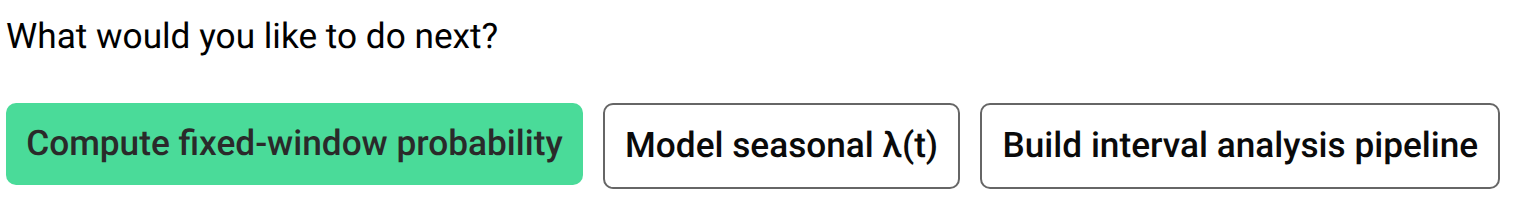
Helper Buttons
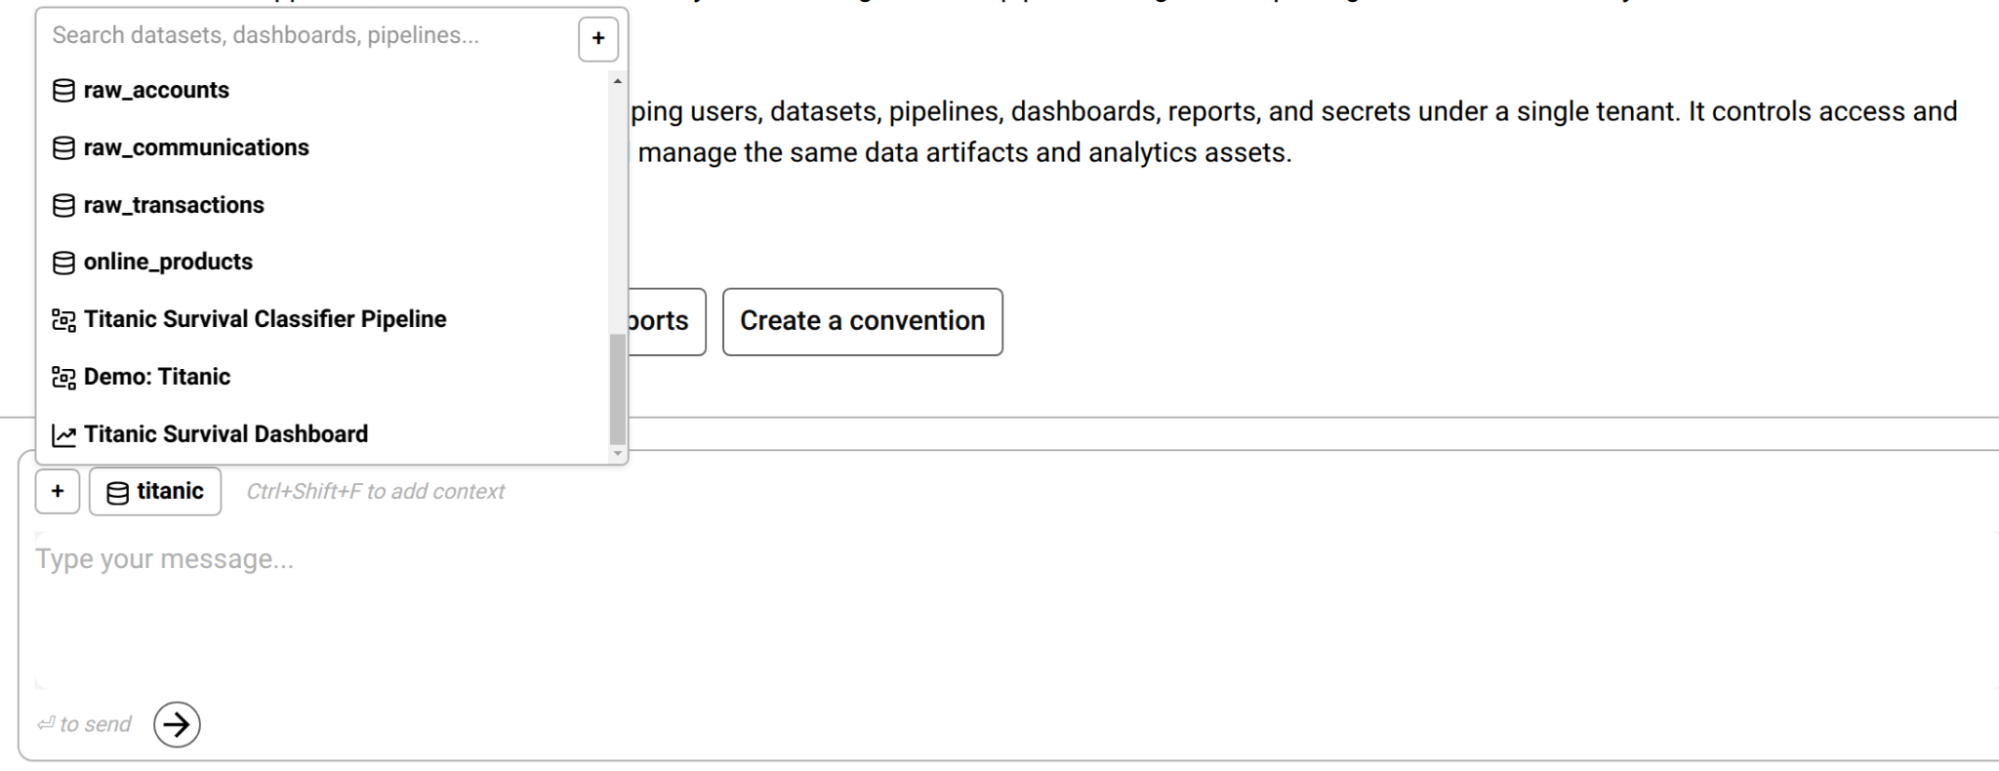
Context
Chat Side Panel
The chat is also available within the Pipeline and Dashboard pages as a collapsible side panel. This panel will default to your last active conversation, and can be changed by clicking the ‘chats’ button.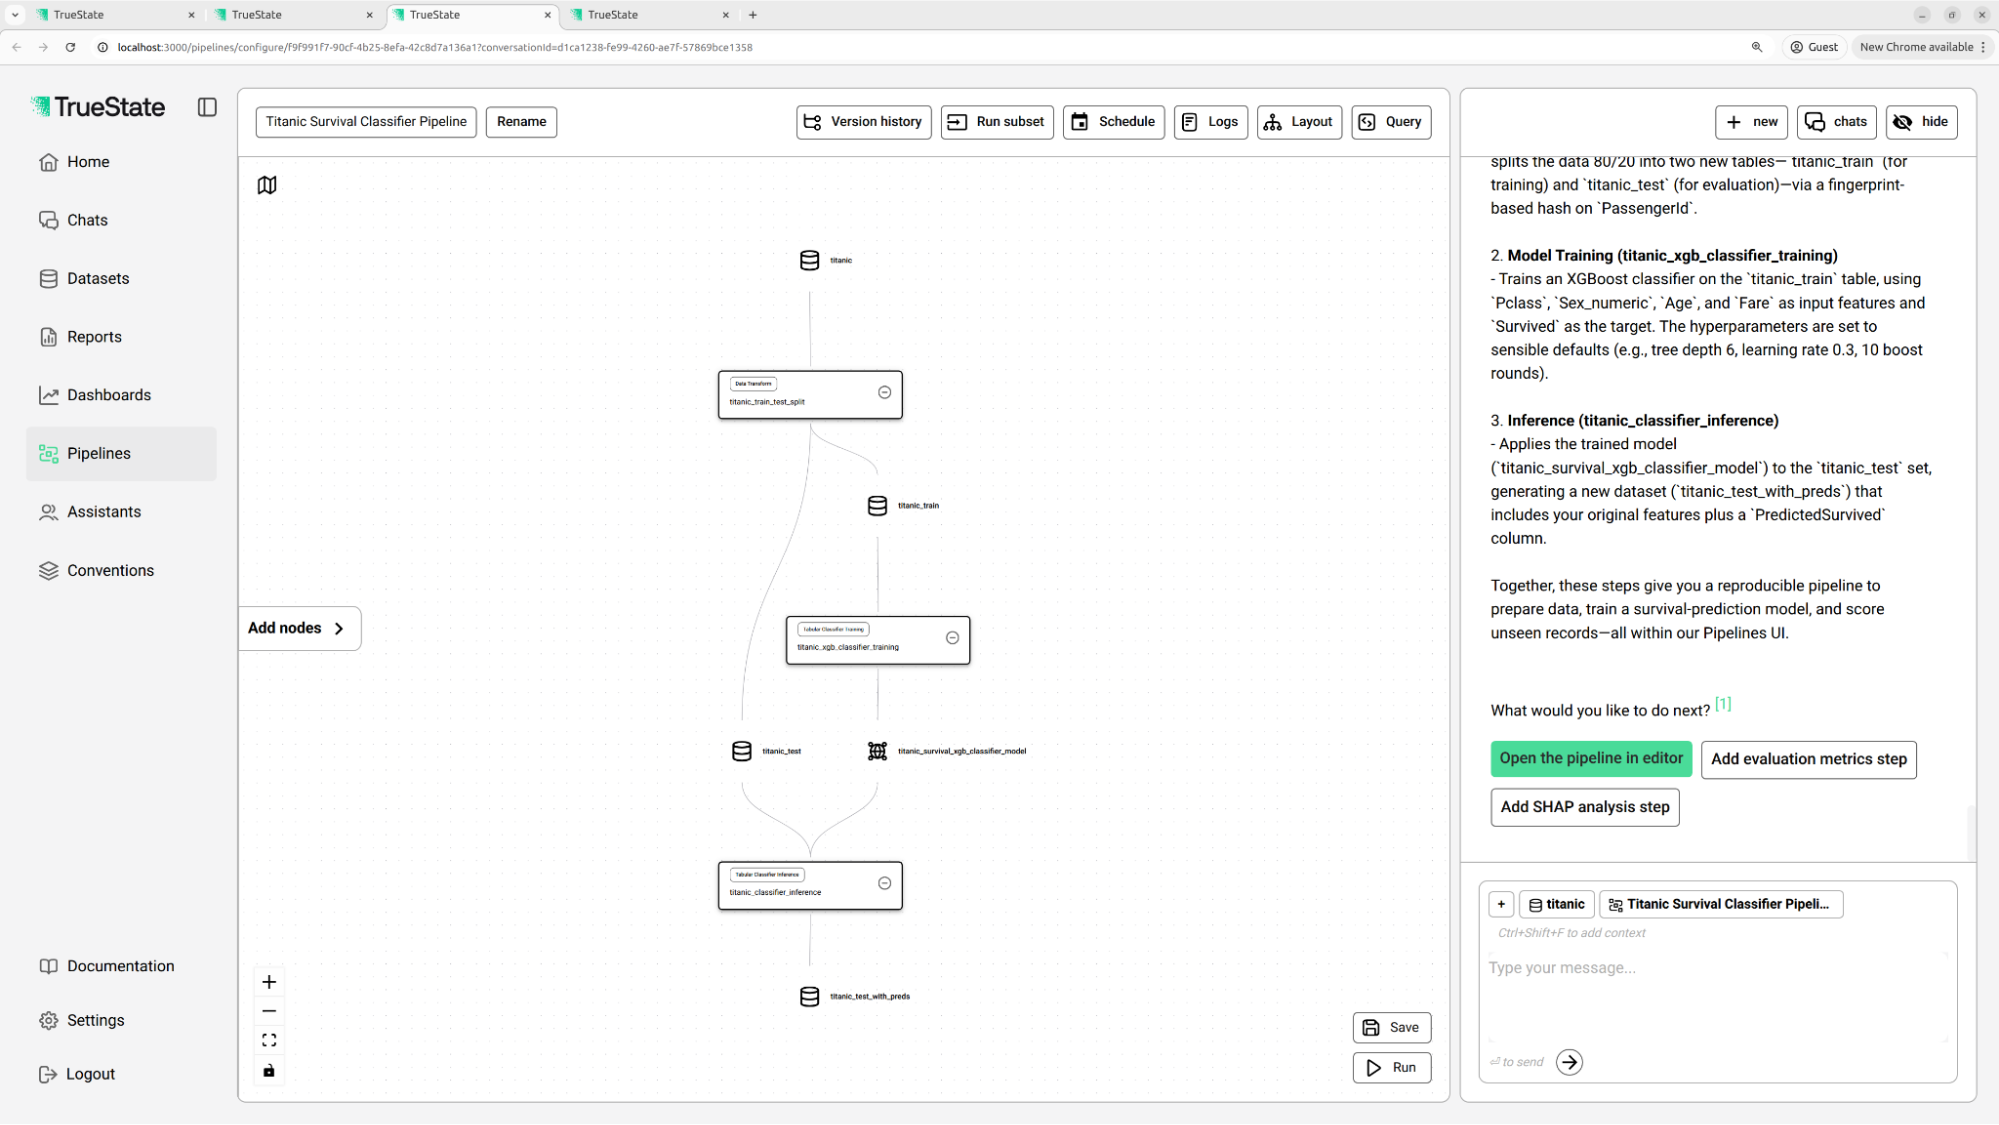
Tools
The TrueState AI Assistant gets its power from its tools. When the bot decides to use a tool, it will be displayed inline in the chat interface. Clicking this display will expand and minimize the tool result.Query Tool
The query tool allows the bot to execute arbitrary SQL commands on a dataset. This is the most powerful tool for performing ad-hoc analysis. The bot is able to understand the information it requires, execute the query to retrieve it, and formulate a response based on what it finds. This grounds the bot response in a truth value, and prevents hallucinations.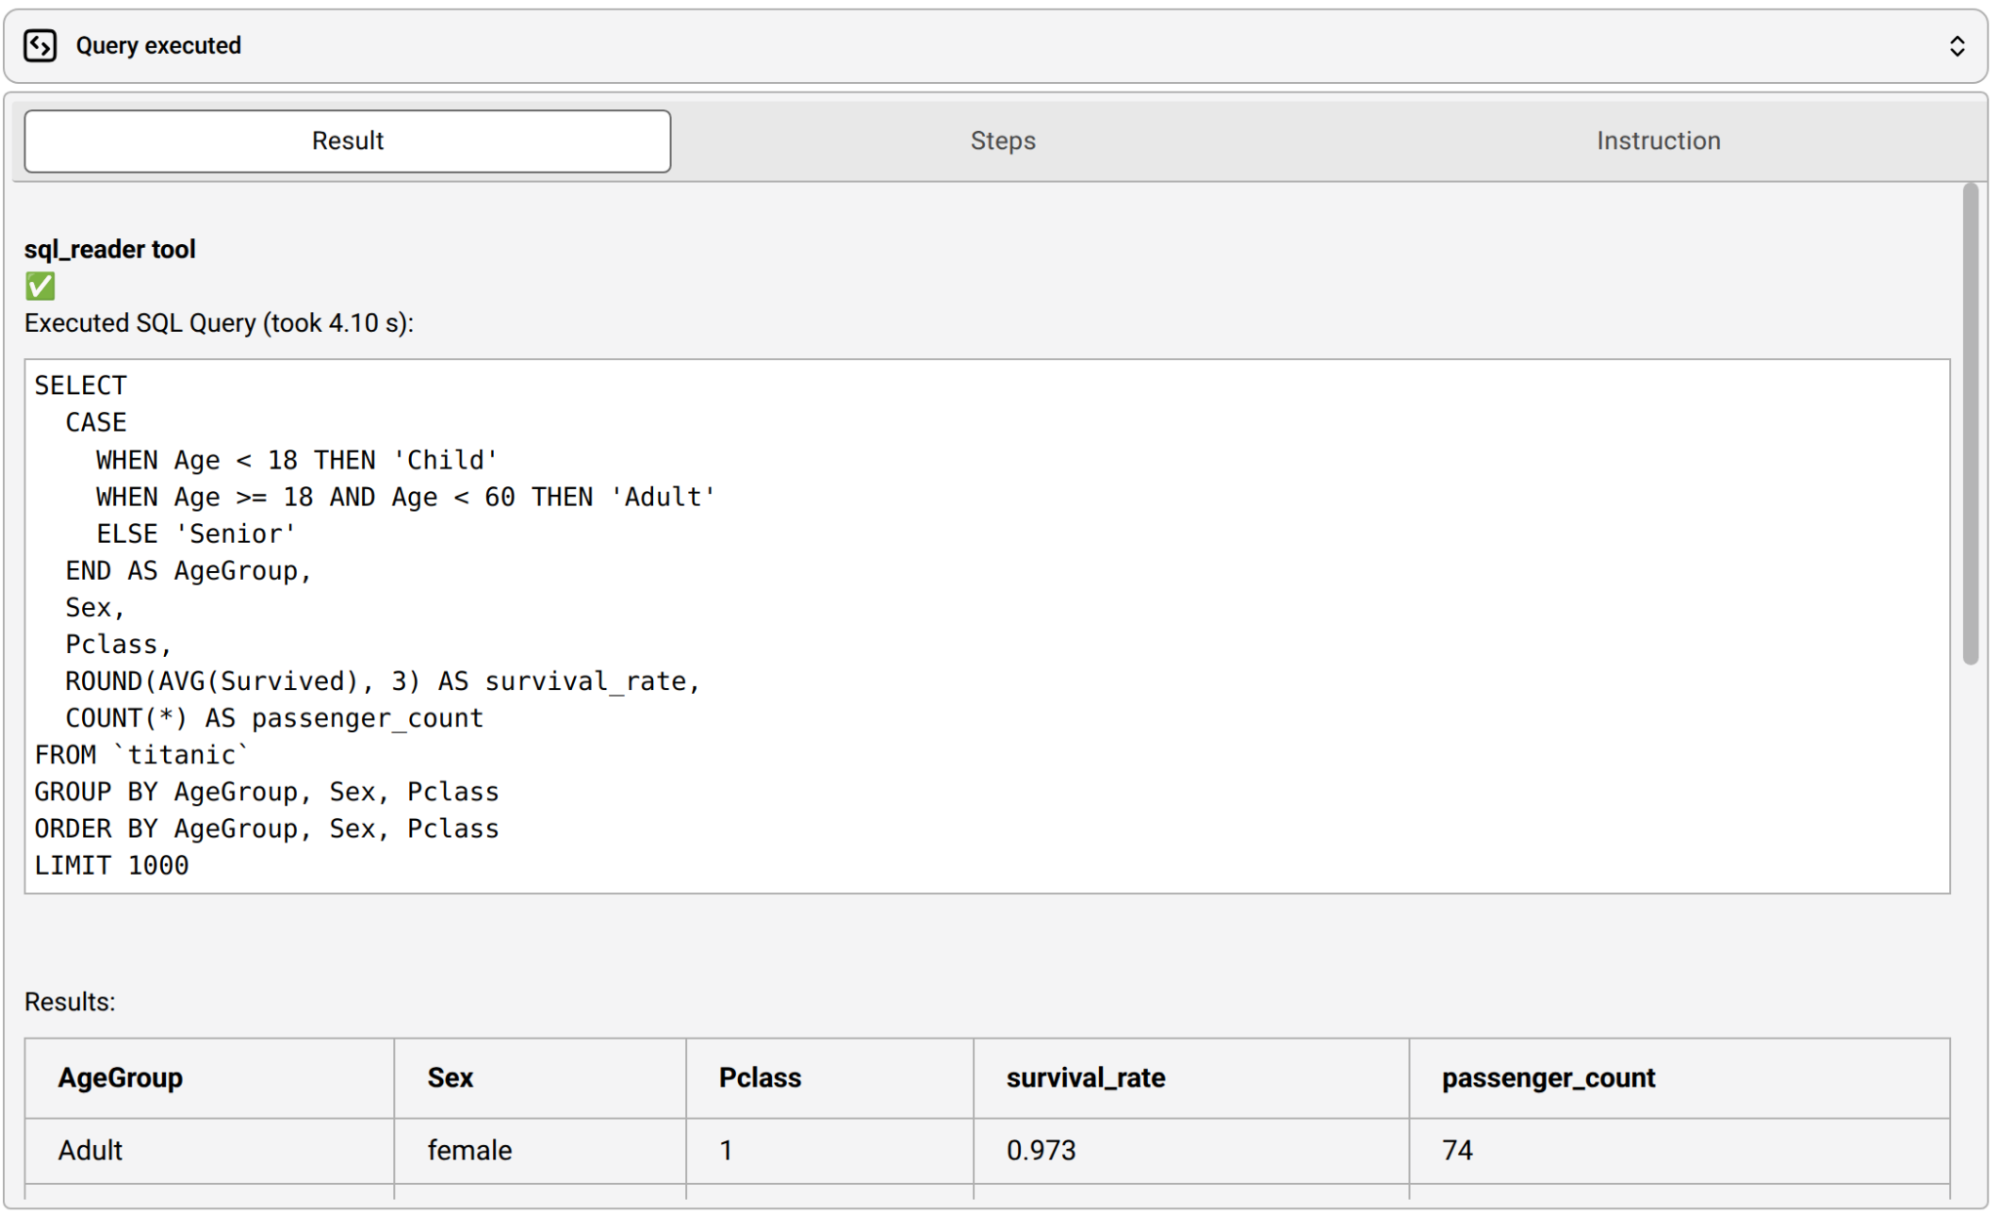
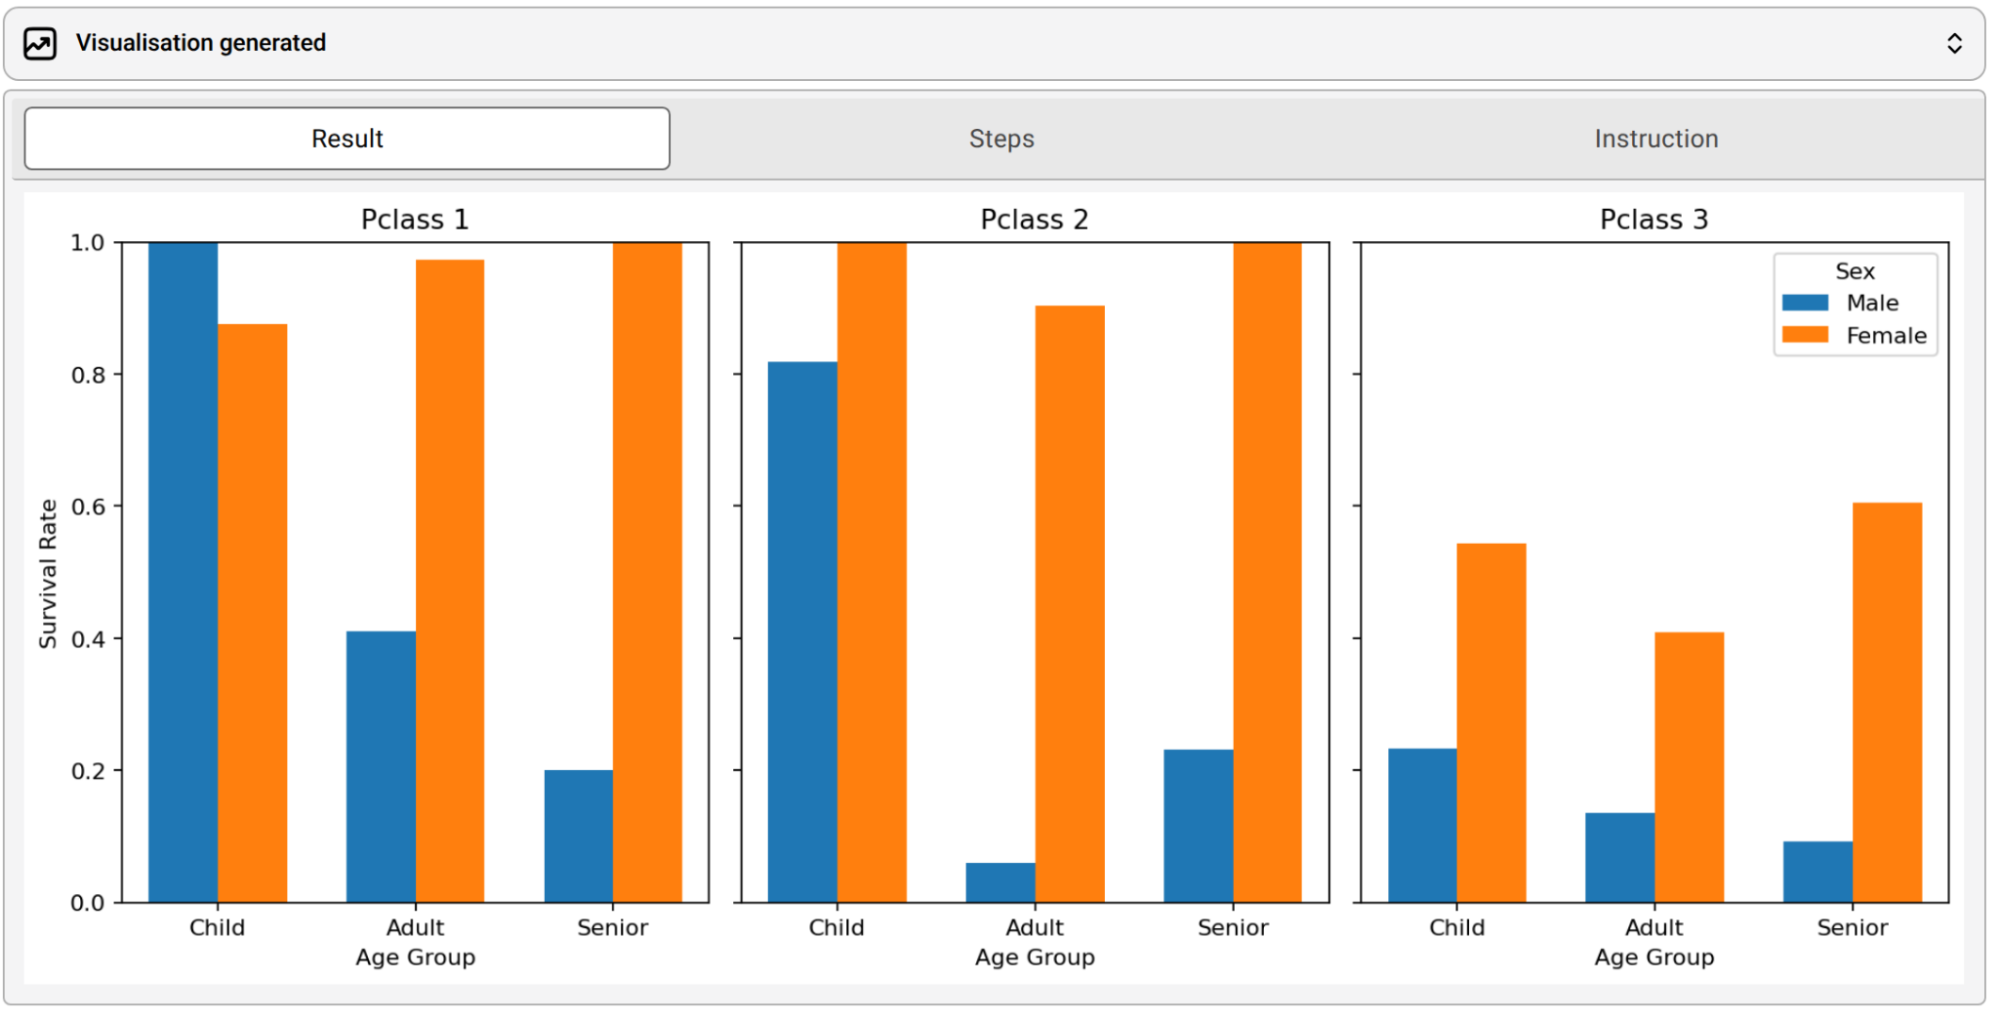
Visualisation Tool
The visualisation tool will produce a figure showing an insight into the data. Just ask the bot to ‘make a figure showing X’ and it will kick off this tool. The bot will write some code using the plotting library matplotlib, execute the code, then use a visual model to look at the results. If the plot is messy or incorrect, it will attempt to improve, and adjust the code accordingly. The bot will attempt this loop until it has successfully produced a figure. This can be viewed in real time by watching the ‘Steps’ tab of the tool output.